

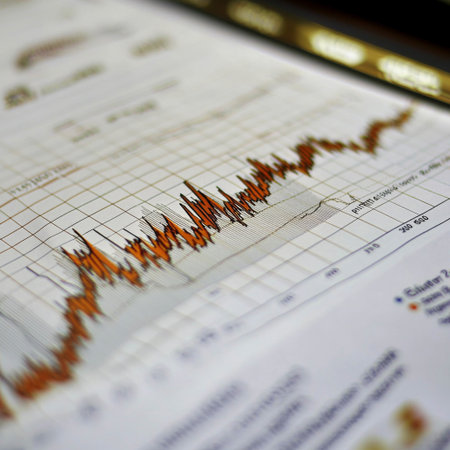
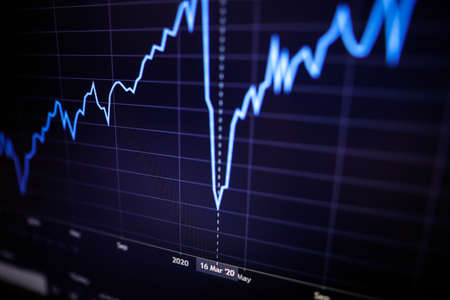
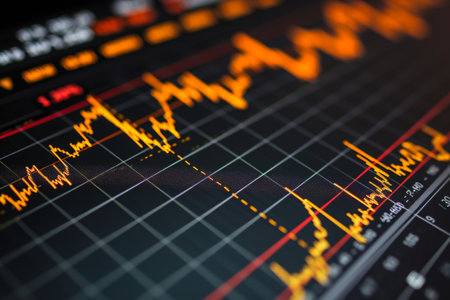
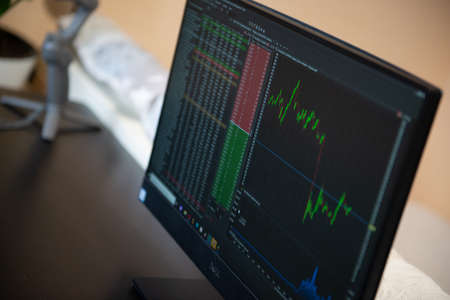
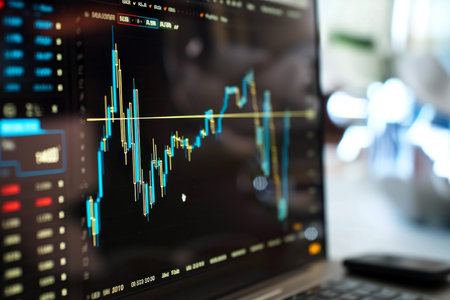
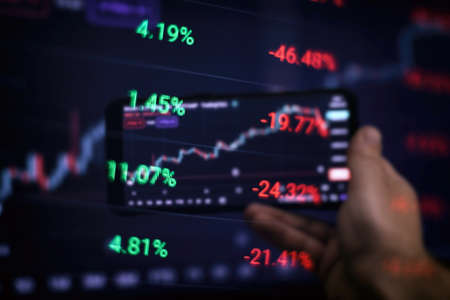
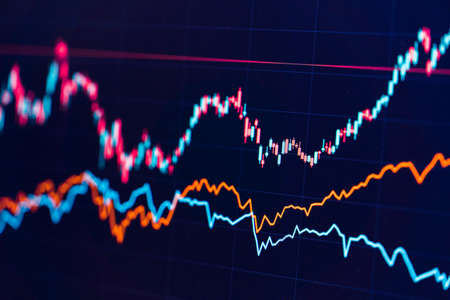
Shallow depth of field (selective focus) with details of a chart showing the stock market crash from March 2020 due to the Covid-19 pandemic on a computer screen (S&P500 index)
Коллекция по умолчанию
Коллекция по умолчанию
Создать новую

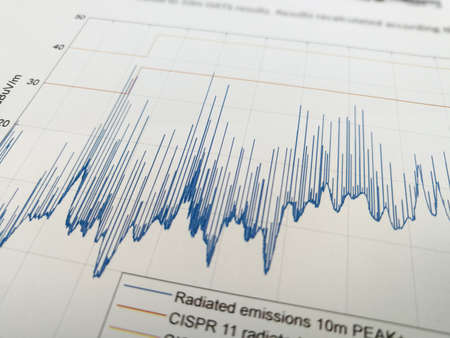
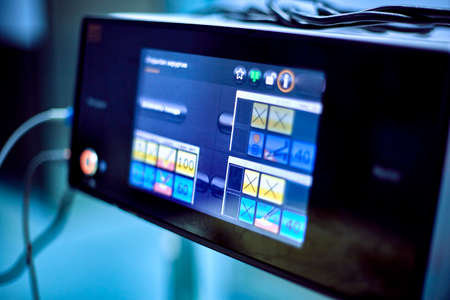
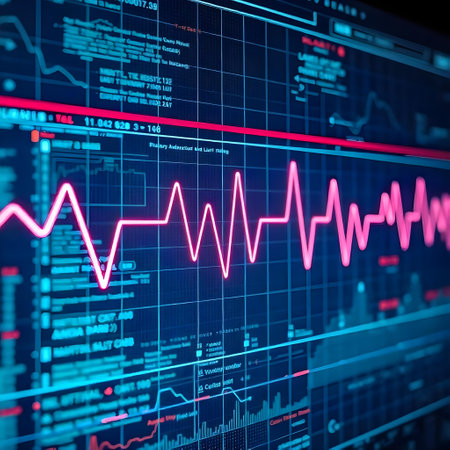
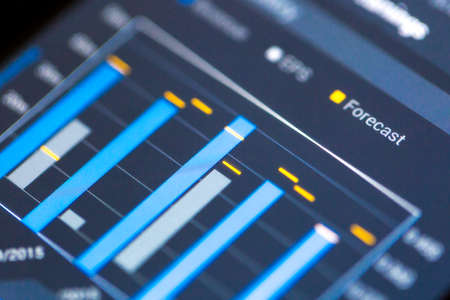
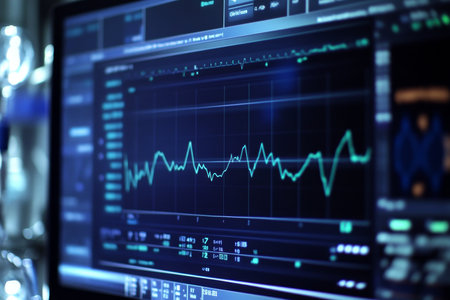
Radiated emissions spectrogram with limit lines in EMC electromagnetic compatibility test report
Коллекция по умолчанию
Коллекция по умолчанию
Создать новую

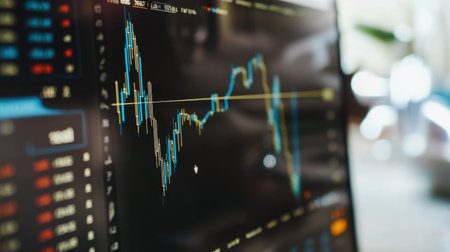
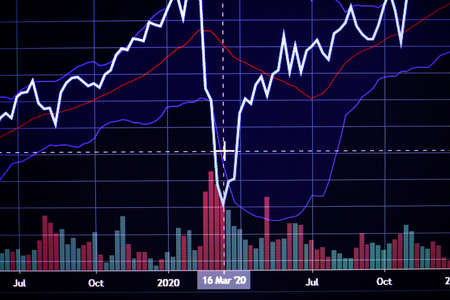
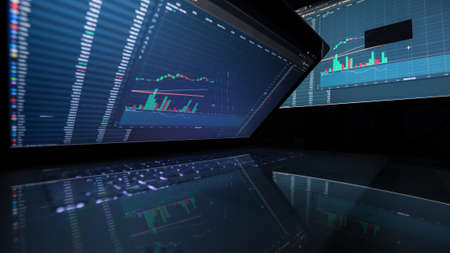
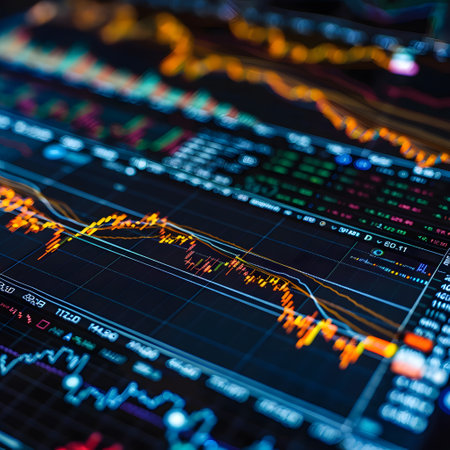
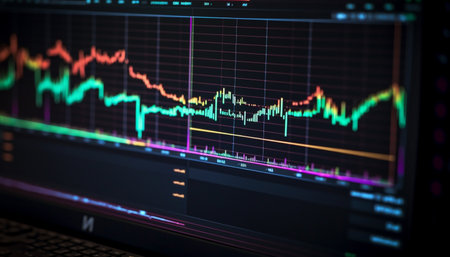
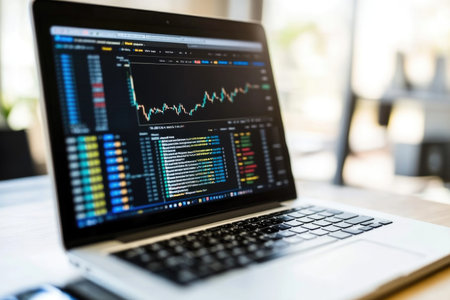
image of the financial graph on a computer monitor.
Коллекция по умолчанию
Коллекция по умолчанию
Создать новую
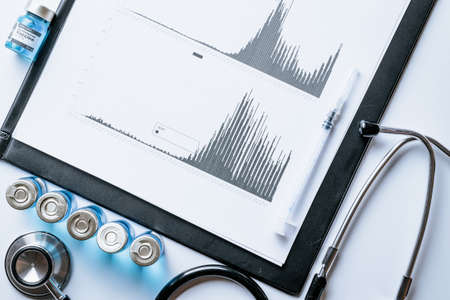
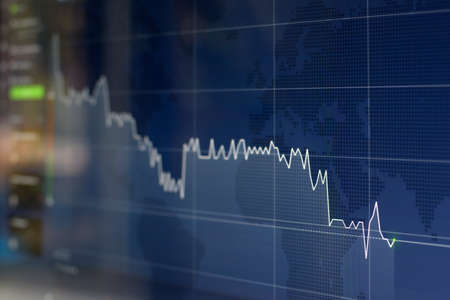
Radiated emissions spectrogram with limit lines in EMC electromagnetic compatibility test report
Коллекция по умолчанию
Коллекция по умолчанию
Создать новую

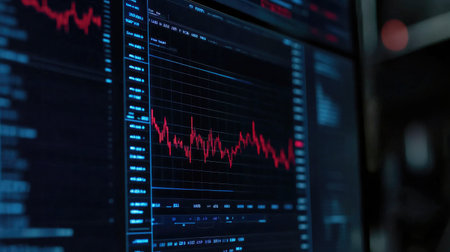
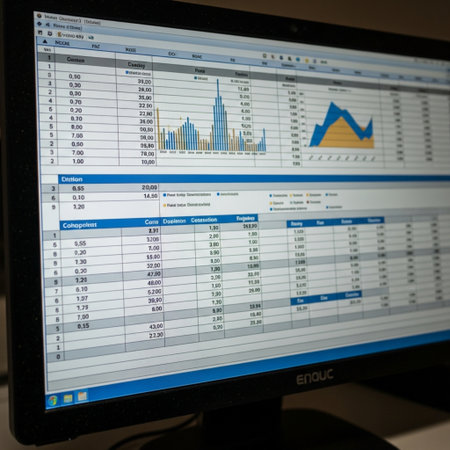
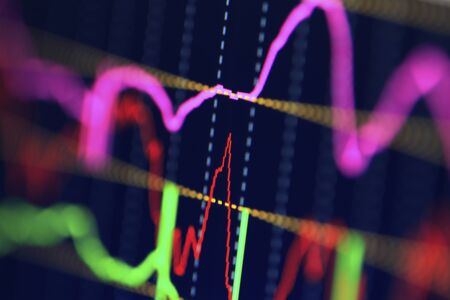
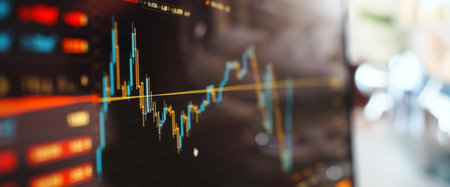
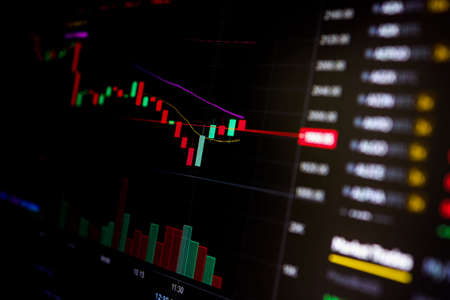
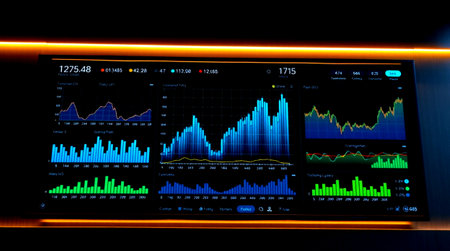
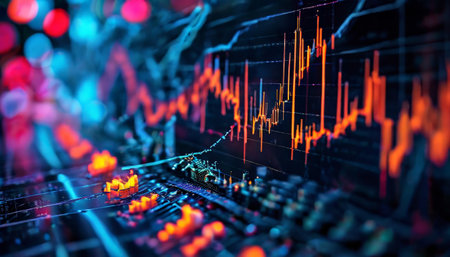
Business chart with line graph, bar chart and numbers on dark background, 3d rendering. Computer digital drawing.
Коллекция по умолчанию
Коллекция по умолчанию
Создать новую

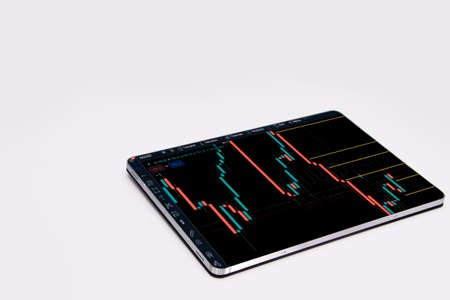
Financial stock market graph. Stock Exchange. Selective focus.
Коллекция по умолчанию
Коллекция по умолчанию
Создать новую
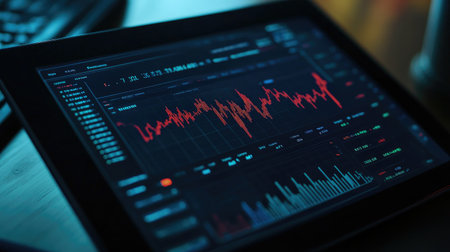
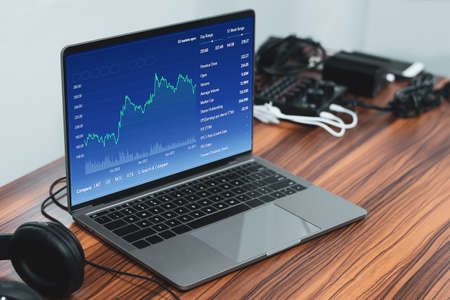
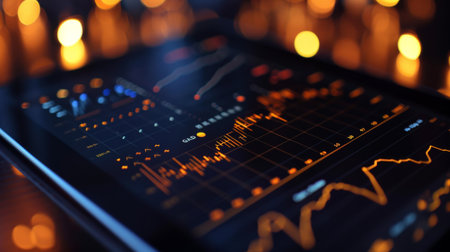
Detailed shot of a stock chart with market trends and performance metrics displayed on a tablet or laptop
Коллекция по умолчанию
Коллекция по умолчанию
Создать новую
View of Stock Market Crash from Covid-19 Pandemic with shallow depth of field.
Коллекция по умолчанию
Коллекция по умолчанию
Создать новую
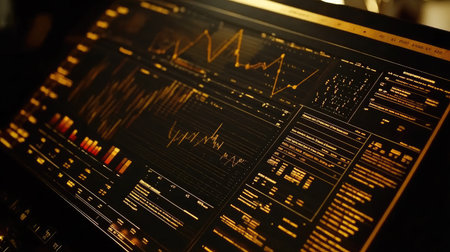
A vibrant image of a large monitor displaying a detailed gold price chart with various technical indicators and a prominent upward trend in gold prices.
Коллекция по умолчанию
Коллекция по умолчанию
Создать новую
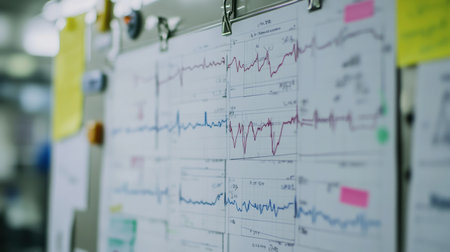
A collection of medical graphs and charts displayed on a clinic wall depicting various data readings. This image captures the essence of data-driven healthcare analysis.
Коллекция по умолчанию
Коллекция по умолчанию
Создать новую

graph of financial growth on a computer monitor.
Коллекция по умолчанию
Коллекция по умолчанию
Создать новую
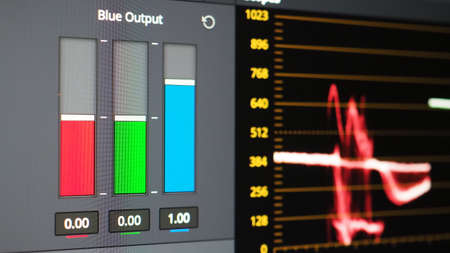
Color grading graph or RGB colour correction indicator on monitor in post production process. Telecine stage in video or film production processing. for colorist edit or adjust color on digital movie.
Коллекция по умолчанию
Коллекция по умолчанию
Создать новую
Close-up of a sophisticated data visualization dashboard featuring various graphs and analytics for monitoring performance and trends in real-time.
Коллекция по умолчанию
Коллекция по умолчанию
Создать новую
The dynamics of changes in currencies. Price growth chart and economic recovery
Коллекция по умолчанию
Коллекция по умолчанию
Создать новую
A luxury-themed financial report page with a gold line graph and stock market indicators
Коллекция по умолчанию
Коллекция по умолчанию
Создать новую

A stock market graph on a black background.
Коллекция по умолчанию
Коллекция по умолчанию
Создать новую

Close-up of a cardiogram with a syringe in a clinical setting. The image captures essential health monitoring elements, emphasizing the medical field.
Коллекция по умолчанию
Коллекция по умолчанию
Создать новую

Businessmen miniature figure standing on investment and profit graph for analysis and discussion.
Коллекция по умолчанию
Коллекция по умолчанию
Создать новую
A financial chart illustrates a notable surge in stock market profits, fueled by rising interest rates and consistent growth in money investments during recent months.
Коллекция по умолчанию
Коллекция по умолчанию
Создать новую

Business and Economy Theme. Trading Cryptocurrencies. Stock Market Candles Chart on Computer Display Close Up.
Коллекция по умолчанию
Коллекция по умолчанию
Создать новую
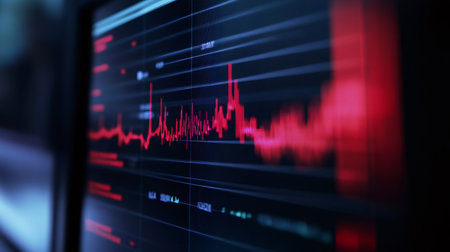
Close-up of stock market data displayed on a digital interface, featuring red trend lines and charts. Ideal for finance and technology themes.
Коллекция по умолчанию
Коллекция по умолчанию
Создать новую
Tablet Index, Exchange Trading Forex Finance Graphic Concept
Коллекция по умолчанию
Коллекция по умолчанию
Создать новую
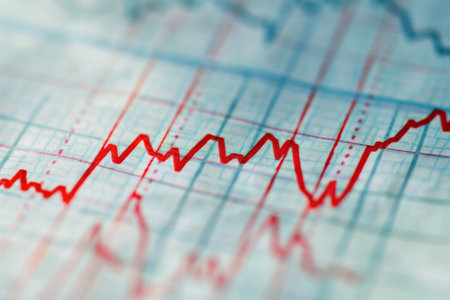
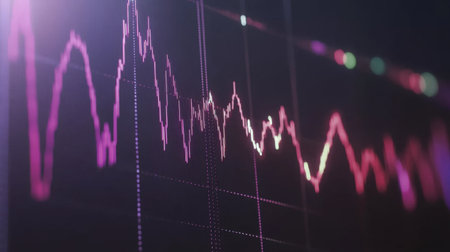
A detailed view of a financial chart showcasing rising and falling stock market trends with red lines illustrating recent price fluctuations on grid paper.
Коллекция по умолчанию
Коллекция по умолчанию
Создать новую
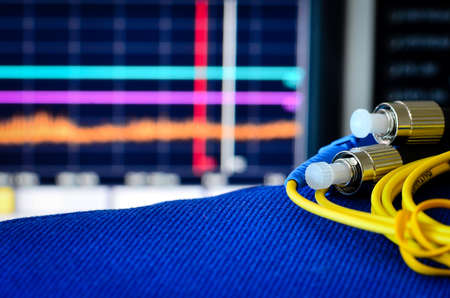
Fibre optic cable with spectrum analyser in the background
Коллекция по умолчанию
Коллекция по умолчанию
Создать новую
Red seismic waves pulsating on a dark monitoring screen indicate ongoing earthquake activity, providing crucial real time data for geologists and researchers
Коллекция по умолчанию
Коллекция по умолчанию
Создать новую

Financial data on a monitor,Stock market data on LED display concept
Коллекция по умолчанию
Коллекция по умолчанию
Создать новую

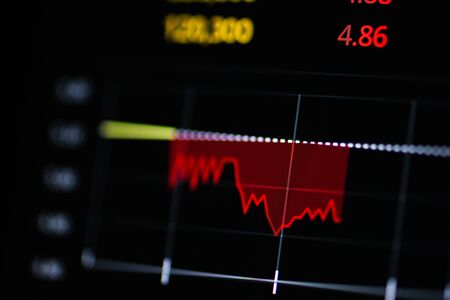
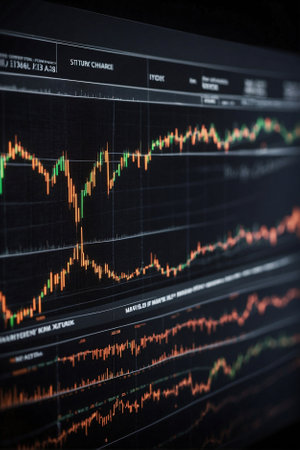
The Stock Exchange, Streaming Trade Screen, The stock screen shows a list of stocks with reduced value.
Коллекция по умолчанию
Коллекция по умолчанию
Создать новую
Shallow depth of field (selective focus) with details of a chart showing the stock market crash from March 2020 due to the Covid-19 pandemic on a computer screen (S&P500 index)
Коллекция по умолчанию
Коллекция по умолчанию
Создать новую

Stockmarket online trading chart candlestick on crypto currency platform. Stock exchange financial market price candles graph data pattern analysis concept. Computer screen closeup background
Коллекция по умолчанию
Коллекция по умолчанию
Создать новую
Modern digital healthcare tablet with abstract medical pulse waves on blue screen
Коллекция по умолчанию
Коллекция по умолчанию
Создать новую
Digital multimeter for measuring the parameters of the machine. 3d rendering
Коллекция по умолчанию
Коллекция по умолчанию
Создать новую

financial graph on the monitor, business concept of financial data analysis.
Коллекция по умолчанию
Коллекция по умолчанию
Создать новую
Maski, India - April 14, 2020 : Crash in sensex share market on mobile during covid-19 lockdown.
Коллекция по умолчанию
Коллекция по умолчанию
Создать новую
graph of financial growth on a computer monitor. cryptocurrency.
Коллекция по умолчанию
Коллекция по умолчанию
Создать новую
A zoomed-in view of a real-time stock market chart being displayed on a computer monitor, A chart displaying the correlations between different financial markets, AI Generated
Коллекция по умолчанию
Коллекция по умолчанию
Создать новую

Color grading monitor. RGB colour correction indicator graph on screen in post production process. Telecine stage in video or film production processing. for colorist edit or adjust on digital movie.
Коллекция по умолчанию
Коллекция по умолчанию
Создать новую
electronic device, monitor in the operating room
Коллекция по умолчанию
Коллекция по умолчанию
Создать новую
Shallow depth of field (selective focus) with details of a chart showing the stock market crash from March 2020 due to the Covid-19 pandemic on a computer screen (S&P500 index)
Коллекция по умолчанию
Коллекция по умолчанию
Создать новую

Financial instruments with various types of indicators including volume analysis for professional technical analysis
Коллекция по умолчанию
Коллекция по умолчанию
Создать новую
financial chart on a computer monitor, closeup photo with shallow depth of field
Коллекция по умолчанию
Коллекция по умолчанию
Создать новую

Financial stock market graph. Stock Exchange. Selective focus.
Коллекция по умолчанию
Коллекция по умолчанию
Создать новую
abstract blue background with red electrocardiogram. 3d rendering
Коллекция по умолчанию
Коллекция по умолчанию
Создать новую
Laptop screen with stock market charts. Technical analysis and fundamental indicators of stock quotes in the trading terminal. Japanese candlesticks and company tickers.
Коллекция по умолчанию
Коллекция по умолчанию
Создать новую
Medical graphic. Healthcare medical infographic, doctor health stethoscope and analysis vaccination statistics on hospital background. Global economy recovery after concept
Коллекция по умолчанию
Коллекция по умолчанию
Создать новую

Financial stock market graph. Stock Exchange. Selective focus.
Коллекция по умолчанию
Коллекция по умолчанию
Создать новую

Business financial or stock market background. Business graph on stock market financial exchange
Коллекция по умолчанию
Коллекция по умолчанию
Создать новую

Sales profit numbers changing on monitor after global trade, real time exchange market stocks statistics growing. Financial graphs showing money trend, risk buying. Close up. Tripod shot.
Коллекция по умолчанию
Коллекция по умолчанию
Создать новую
Stock price graph
Коллекция по умолчанию
Коллекция по умолчанию
Создать новую

ICON ICX Cryptocurrency. coin growth chart on the exchange, chart
Коллекция по умолчанию
Коллекция по умолчанию
Создать новую
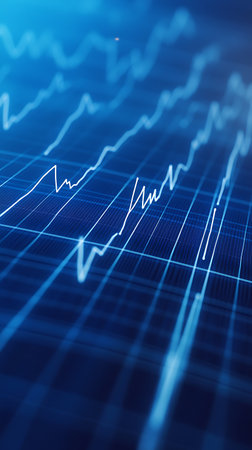
This striking abstract image shows white financial graphs plotted on a blue grid. It represents market analysis, economic trends, and data visualization for finance concepts.
Коллекция по умолчанию
Коллекция по умолчанию
Создать новую
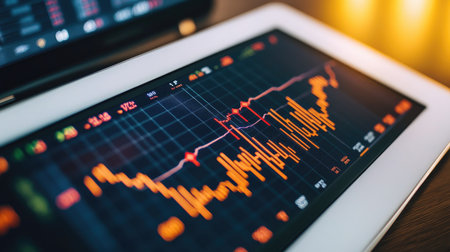
Detailed shot of a stock chart with market trends and performance metrics displayed on a tablet or laptop
Коллекция по умолчанию
Коллекция по умолчанию
Создать новую

Vibrant candlestick patterns and descending trend lines illustrate a market downturn, highlighting analysis tools amid a somber financial atmosphere.
Коллекция по умолчанию
Коллекция по умолчанию
Создать новую
Stock Market Chart on Dark Background: Financial Analytics. Digital Art: Modern Technologies
Коллекция по умолчанию
Коллекция по умолчанию
Создать новую
Business and trading finance contept. Stock exchange market chart view on smart phone screen.
Коллекция по умолчанию
Коллекция по умолчанию
Создать новую
RUSSIA - FEBRUARY 22 2021. Trading on the stock exchange from home in the first person
Коллекция по умолчанию
Коллекция по умолчанию
Создать новую
Close up of digital screen displaying line graph of cancer research trends and medical insights
Коллекция по умолчанию
Коллекция по умолчанию
Создать новую
Computer screen displaying colorful graphs and various electronic equipment
Коллекция по умолчанию
Коллекция по умолчанию
Создать новую
Line chart showing market trading conditions on blue background.
Коллекция по умолчанию
Коллекция по умолчанию
Создать новую
Stock market data analyzing graph showing on laptop screen with shallow depth of field
Коллекция по умолчанию
Коллекция по умолчанию
Создать новую
A close-up shot of a stock market chart displayed on a laptop screen, showing financial data and market trends.
Коллекция по умолчанию
Коллекция по умолчанию
Создать новую
Abstract image of financial data and stock market analysis with colorful graphs and charts, representing economic trends and market fluctuations.
Коллекция по умолчанию
Коллекция по умолчанию
Создать новую

Indicators including volume analysis for professional technical analysis on the monitor of a computer. Fundamental and technical analysis concept.
Коллекция по умолчанию
Коллекция по умолчанию
Создать новую

Online stock exchange application with information on screen, closeup
Коллекция по умолчанию
Коллекция по умолчанию
Создать новую

forex trading graph and candlestick chart suitable for financial investment concept. Economy trends background for business idea and all art work design. Abstract finance background.
Коллекция по умолчанию
Коллекция по умолчанию
Создать новую
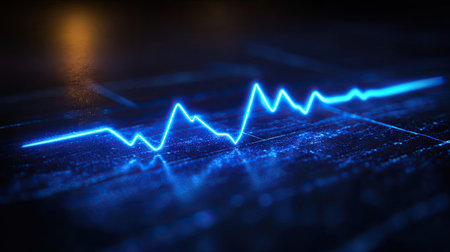
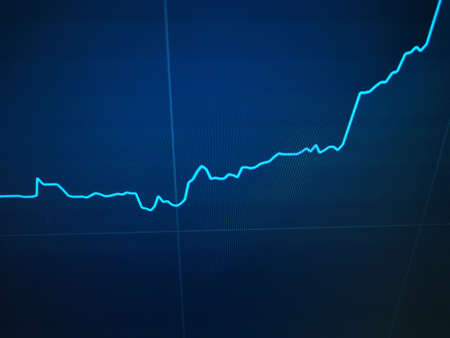
An abstract, glowing blue line undulates across a dark surface in this image. The composition features a shallow depth of field, with soft lighting and a focus on the central element. The color palette primarily uses shades of blue and black. This visual could be utilized in technology, science, or data-related commercial projects.
Коллекция по умолчанию
Коллекция по умолчанию
Создать новую
Working set for analyzing financial statistics and analyzing a market data. Data analysis from charts and graphs
Коллекция по умолчанию
Коллекция по умолчанию
Создать новую

schedules and charts of financial instruments, quotations of currencies, changes in real time. Japanese candlesticks used in technical analysis of market trends.
Коллекция по умолчанию
Коллекция по умолчанию
Создать новую
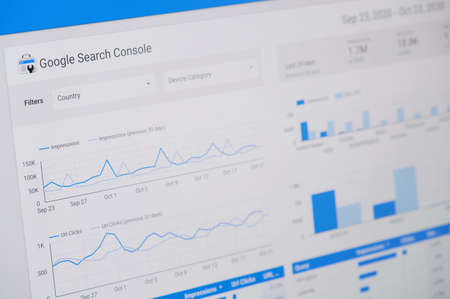
New york, USA - October 23, 2020: Managing google search console screen display close up view
Коллекция по умолчанию
Коллекция по умолчанию
Создать новую
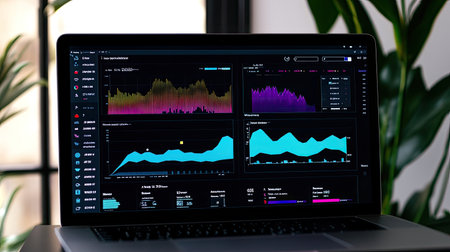
A sleek laptop shows a modern digital dashboard with colorful data visualizations and analytics, set in a contemporary workspace, perfect for business insights.
Коллекция по умолчанию
Коллекция по умолчанию
Создать новую
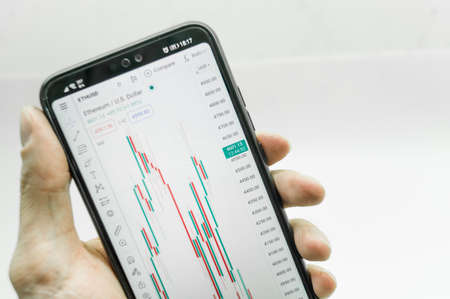
A chart of financial exchange quotes on a smartphone screen in hand. Trading on the stock exchange from a mobile phone. Close-up, selective focus
Коллекция по умолчанию
Коллекция по умолчанию
Создать новую

Real-time analysis of the cryptocurrency market in a smartphone. panorama, macro
Коллекция по умолчанию
Коллекция по умолчанию
Создать новую
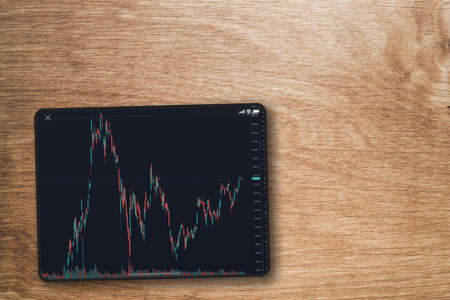
Financial stock market graph on the tablet screen on wooden background. Top view. Stock Exchange.
Коллекция по умолчанию
Коллекция по умолчанию
Создать новую
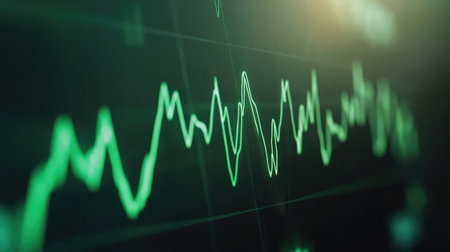
Abstract representation of fluctuating graph lines in green, showcasing data visualization. Perfect for illustrating financial or analytical concepts.
Коллекция по умолчанию
Коллекция по умолчанию
Создать новую

Data analyzing in Forex, Commodities, Equities, Fixed Income and Emerging Markets: the charts and summary info show about Business statistics and Analytics value - Wealth management concept.
Коллекция по умолчанию
Коллекция по умолчанию
Создать новую
Close-up of a waveform on an audio analyzer screen, showing detailed peaks and troughs of electrical signals
Коллекция по умолчанию
Коллекция по умолчанию
Создать новую
Colorful abstract graph showcasing data trends with fluctuating lines. Ideal for finance and technology themes, emphasizing analysis and visualization.
Коллекция по умолчанию
Коллекция по умолчанию
Создать новую
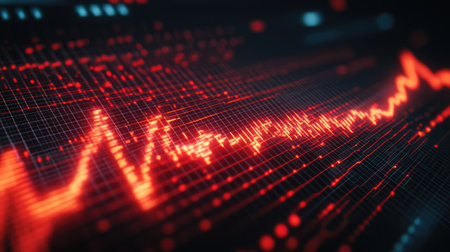
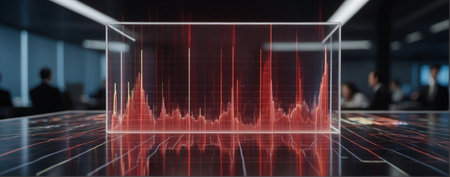
Glowing Red Volatility Graph Shows Downturn In Financial Market Analytics Over Grid Data.
Коллекция по умолчанию
Коллекция по умолчанию
Создать новую
A close-up of a digital stock market chart displayed on a tablet, showing fluctuating lines and numbers, capturing the essence of trading activities.
Коллекция по умолчанию
Коллекция по умолчанию
Создать новую
A neon-style red ECG waveform with a bright glowing effect on a digital screen.
Коллекция по умолчанию
Коллекция по умолчанию
Создать новую

Futuristic UI HUD Head up display analytic screen with sensors detectors and bars
Коллекция по умолчанию
Коллекция по умолчанию
Создать новую
A line chart index for the past 10 years with a green background and a yellow line.
Коллекция по умолчанию
Коллекция по умолчанию
Создать новую
Financial stock market graph. Stock Exchange. Selective focus.
Коллекция по умолчанию
Коллекция по умолчанию
Создать новую

Ecu tuning software screen detail with map opened for modifications
Коллекция по умолчанию
Коллекция по умолчанию
Создать новую
Minimalist Financial Analysis on Laptop with Stock Market Charts.
Коллекция по умолчанию
Коллекция по умолчанию
Создать новую
Stock exchange, cryptocurrency price chart on a screen. Candlestick chart, btc. Online currency exchange market. Trading, bidding. Tracking the cryptocurrency rate. 4K. Close up.
Коллекция по умолчанию
Коллекция по умолчанию
Создать новую
Trading online digital graph chart in computer technology at home , Trader business trad stock exchange
Коллекция по умолчанию
Коллекция по умолчанию
Создать новую

Candle stick graph chart with indicator showing bullish point or bearish point, up trend or down trend of price of stock market or stock exchange trading, investment and financial concept.
Коллекция по умолчанию
Коллекция по умолчанию
Создать новую

Fundamental and technical analysis concept.
Коллекция по умолчанию
Коллекция по умолчанию
Создать новую
Color grading graph or RGB colour correction indicator on monitor in post production process. Telecine stage in video or film production processing. for colorist edit or adjust color on digital movie.
Коллекция по умолчанию
Коллекция по умолчанию
Создать новую
Stock market chart on LED display, stock market data analysis concept.
Коллекция по умолчанию
Коллекция по умолчанию
Создать новую
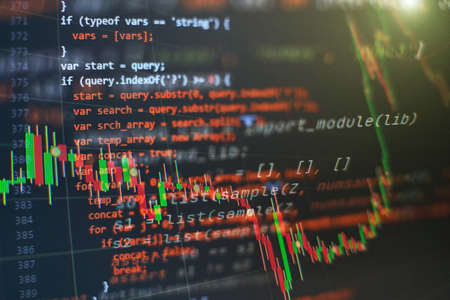
CSS, JavaScript and HTML usage. Monitor closeup of function source code. Abstract IT technology background. Software source code.
Коллекция по умолчанию
Коллекция по умолчанию
Создать новую

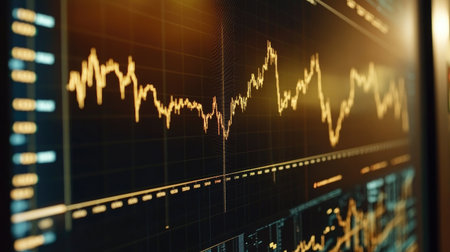
Abstract glowing forex chart interface wallpaper. Investment, trade, stock, finance and analysis concept.
Коллекция по умолчанию
Коллекция по умолчанию
Создать новую

Stock market candlestick chart, asset prices movement, currency exchange price action simple concept. Computer screen, display, candle chart, graph detail, extreme closeup, nobody, no people
Коллекция по умолчанию
Коллекция по умолчанию
Создать новую
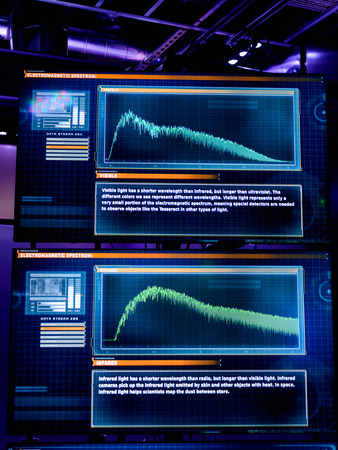
LAS VEGAS, NV, USA - SEP 20, 2017: Tesseract experiment at the Avengers Station complex in Las Vegas.
Коллекция по умолчанию
Коллекция по умолчанию
Создать новую
A digital tablet with a detailed gold price chart and economic indicators.
Коллекция по умолчанию
Коллекция по умолчанию
Создать новую
Financial stock market data visualization with charts
Коллекция по умолчанию
Коллекция по умолчанию
Создать новую
Business and trading finance contept. Stock exchange market chart view on smart phone screen.
Коллекция по умолчанию
Коллекция по умолчанию
Создать новую
professionals analyzing financial data. Red digital graphs overlaid in a modern office environment, integrating technology and data analysis into daily business operations.
Коллекция по умолчанию
Коллекция по умолчанию
Создать новую

Virus pandemic covid-19 map on pc screen, global infection, internet.
Коллекция по умолчанию
Коллекция по умолчанию
Создать новую
A detailed financial chart with currency trading trends and technical analysis tools for investors focused on maximizing portfolio profitability --chaos 70
Коллекция по умолчанию
Коллекция по умолчанию
Создать новую
Legion-Media
Создайте свои проекты на основе качественных стоковых фотографий и видео.


Copyright © Legion-Media.